http://www.accountingformanagement.org/break-even-point-analysis/
Explanation of break-even point:
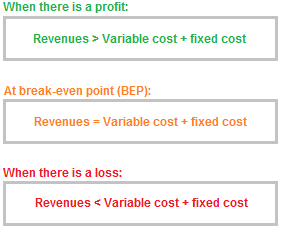
The point at which total of fixed and variable costs of a business becomes equal to its total revenue is known as break-even point (BEP). At this point, a business neither earns any profit nor suffers any loss. Break-even point is therefore also known as no-profit, no-loss point or zero profit point. Calculation of break-even point is important for every business because it tells business owners and managers how much sales are needed to cover all fixed as well as variable expenses of the business or the sales volume after which the business will start generating profit. The computation of sales volume required to break-even is known as break-even analysis. The concept explained above can also be presented as follows:
After reading this article you will be able to compute the break-even point of a single product company using two popular methods – equation method and contribution margin method. First we shall compute break-even point using these two methods and then present the information graphically (preparation of break-even chart).
Computation of break-even point:
(1). Use of equation method:
The application of equation method facilitates the computation of break-even point both in units and in dollars. As we have already described that the sales are equal to total variable and fixed expenses at break-even point, the equation can therefore be written as follows:
Sp × Q = Ve × Q + Fe
Or
SpQ = VeQ + Fe
Where;
Sp = Sales price per unit.
Q = Number (quantity) of units to be manufactured and sold during the period.
Ve = Variable expenses to manufacture and sell a single unit of product.
Fe = Total fixed expenses for the period.
Notice that the left hand side of the equation represents the total sales in dollars and the right hand side of the equation represents the total cost. If the information about sales price per unit, variable expenses per unit and the total fixed expenses is available, we can solve the equation for ‘Q’ to find the number of units to break-even. The break-even point in units can then be multiplied by the sales price per unit to calculate the break-even point in dollars. Suppose, for example, you run a manufacturing business that is involved in manufacturing and selling a single product. The annual fixed expenses to run the business are $15,000 and variable expenses are $7.50 per unit. The sale price of your product is $15 per unit. The number of units to be sold to break even can be easily calculated using equation method:
Sp × Q = Ve × Q + Fe
15 × Q = 7.5 × Q + 15,000
15 Q = 7.5 Q + 15,000
15Q – 7.5Q = 15,000
7.5Q = 15,000
Q = 15,000 / 7.5
Q = 2,000 units
The break-even point in units is 2,000 units and the break-even point in dollars can be computed as follows:
= (2,000 units) × ($15)
= $30,000
(2). Use of contribution margin method:
The method described above is known as equation method of calculating break-even point. Some people use another method called contribution margin method (read about contribution margin and its calculation). Under this method, the total fixed expenses are divided by contribution margin per unit. Consider the following computations:
Total fixed expenses / Contribution margin per unit
= 15,000 / 7.5*
= 2,000 units
or
= (2,000 units) × ($15)
= $30,000
*$15 – $7.5
A little variation of this method is to divide the total fixed expenses by the contribution margin ratio (CM ratio). Doing so results in break-even point in dollars. It is shown below:
Total fixed expenses / Contribution margin ratio
= $15,000 / 0.5*
= $30,000
*($15 – $17.5)/$15
Graphical presentation (Preparation of break-even chart or CVP graph):
The graphical presentation of dollar and unit sales needed to break-even is known as break-even chart orCVP graph:
Explanation of the graph:
- The number of units have been presented on the X-axis (horizontally) where as dollars have been presented on Y-axis (vertically).
- The straight line in red color represents the total annual fixed expenses of $15,000.
- The blue line represents the total expenses. Notice that the line has a positive or upward slop that indicates the effect of increasing variable expenses with the increase in production.
- The green line with positive or upward slop indicates that every unit sold increases the total sales revenue.
- The total revenue line and the total expenses line cross each other. The point at which they cross each other is the break-even point. Notice that the total expenses line is above the total revenue line before the point of intersection and below after the point of intersection. It tells us that the business suffers a loss before the point of intersection and makes a profit after this point. The break-even point in the above graph is 2,000 units or $30,000 that agrees with the break-even point computed using equation and contribution margin methods above.
- The difference between the total expenses line and the total revenue line before the point of intersection (BE point) is the loss area. The loss area has been filled with pink color. Notice that this area reduces as the number of units sold increases. It means every additional unit sold before the break-even point reduces the loss.
- The difference between the total expenses line and the total revenue line after the point of intersection (BE point) is the profit area. The profit area has been filled with green color. Notice that this area increases as the number of units sold increases. It means every additional unit sold after the break-even point increases the profit of the business.


No comments:
Post a Comment